Practical Data Visualization with Python
Transform Your Data into Compelling Visual Stories! In the age …
What you'll learn
- Fundamentals of Data Visualization: Understand the importance of data visualization in data analysis and decision-making. Learn about different types of visualizations and when to use them effectively.
- Data Cleaning and Preparation: Discover essential data cleaning techniques using Python libraries like Pandas. Learn how to prepare your data for visualization to ensure accuracy and clarity.
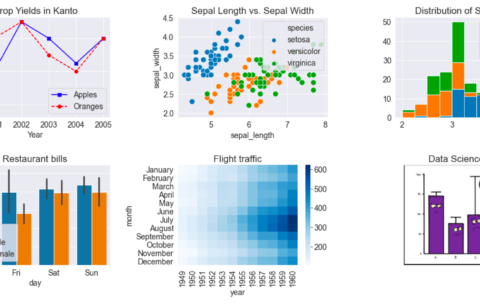
- Advanced Visualization Techniques: Explore advanced visualization methods, including multi-dimensional plots, animated visualizations, and geographical mapping. Gain hands-on experience with popular libraries such as Matplotlib, Seaborn, and Plotly.
- Data Storytelling: Learn how to craft compelling narratives using your visualizations. Understand how to tailor your message to different audiences and apply design principles that enhance storytelling.
- Practical Application: Engage in collaborative projects and hands-on exercises that allow you to apply what you’ve learned. Create your own visualizations and data stories, and receive feedback from peers and instructors.


