Climate Action through Advanced Data Analytics
Unlock the potential of data science in our Climate Action through …
What you'll learn
- Predictive Analytics: Gain a solid understanding of predictive modeling techniques and how to apply them to climate data. You will learn to build models that forecast climate trends and assess the effectiveness of various climate action strategies.
- Data Visualization: Discover how to create compelling visualizations that effectively communicate complex climate data. You will learn to use popular visualization tools and design principles to enhance your presentations.
- Communication Skills: Develop the ability to craft narratives around your data insights. You will learn how to tailor your communication to different audiences, ensuring that your findings resonate and inspire action.
- Evaluation of Climate Strategies: Learn how to evaluate the effectiveness of climate action initiatives using data-driven methodologies. You will assess real-world strategies and provide actionable recommendations based on your analyses.
- Hands-On Projects: Engage in practical projects throughout the course that allow you to apply your skills in real-world scenarios. You will work with actual climate data, develop predictive models, and create visualizations that support climate action.
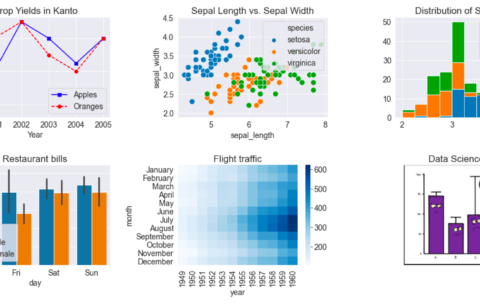
Practical Data Visualization with Python
Transform Your Data into Compelling Visual Stories! In the age …
What you'll learn
- Fundamentals of Data Visualization: Understand the importance of data visualization in data analysis and decision-making. Learn about different types of visualizations and when to use them effectively.
- Data Cleaning and Preparation: Discover essential data cleaning techniques using Python libraries like Pandas. Learn how to prepare your data for visualization to ensure accuracy and clarity.
- Advanced Visualization Techniques: Explore advanced visualization methods, including multi-dimensional plots, animated visualizations, and geographical mapping. Gain hands-on experience with popular libraries such as Matplotlib, Seaborn, and Plotly.
- Data Storytelling: Learn how to craft compelling narratives using your visualizations. Understand how to tailor your message to different audiences and apply design principles that enhance storytelling.
- Practical Application: Engage in collaborative projects and hands-on exercises that allow you to apply what you’ve learned. Create your own visualizations and data stories, and receive feedback from peers and instructors.


